Top Python and R Libraries for Data Science
Data science is a fascinating and promising area that is continuously developing. And the world is now entering the new world of big data, so the need for better and more effective data storage has become a significant concern.

So if you want to start your career in data science, now is the best time. Where do you even start with Python and R. These are emerging so rapidly in the technology sector that they might even replace all the existing programming languages in the very near future. Moreover, knowing Python and R is the best combination; even if you don’t know a little about Python and R or don’t belong to any technical bike background, you can still learn Python and R in so many easy ways.
Why Choose Python?
- Python is a very powerful and easy-to-use programming language. Aspirants and researchers with basic knowledge can use Python and start working on any platform.
- Python has the choice of libraries well; it provides a massive collection of Machin Learning and Artificial Intelligence libraries.
- It is a highly scalable and faster language when compared to any other language.
- It has amazing graphical and visualization tools and libraries that will help you analyze your data well.
Top Python Libraries for Data Science
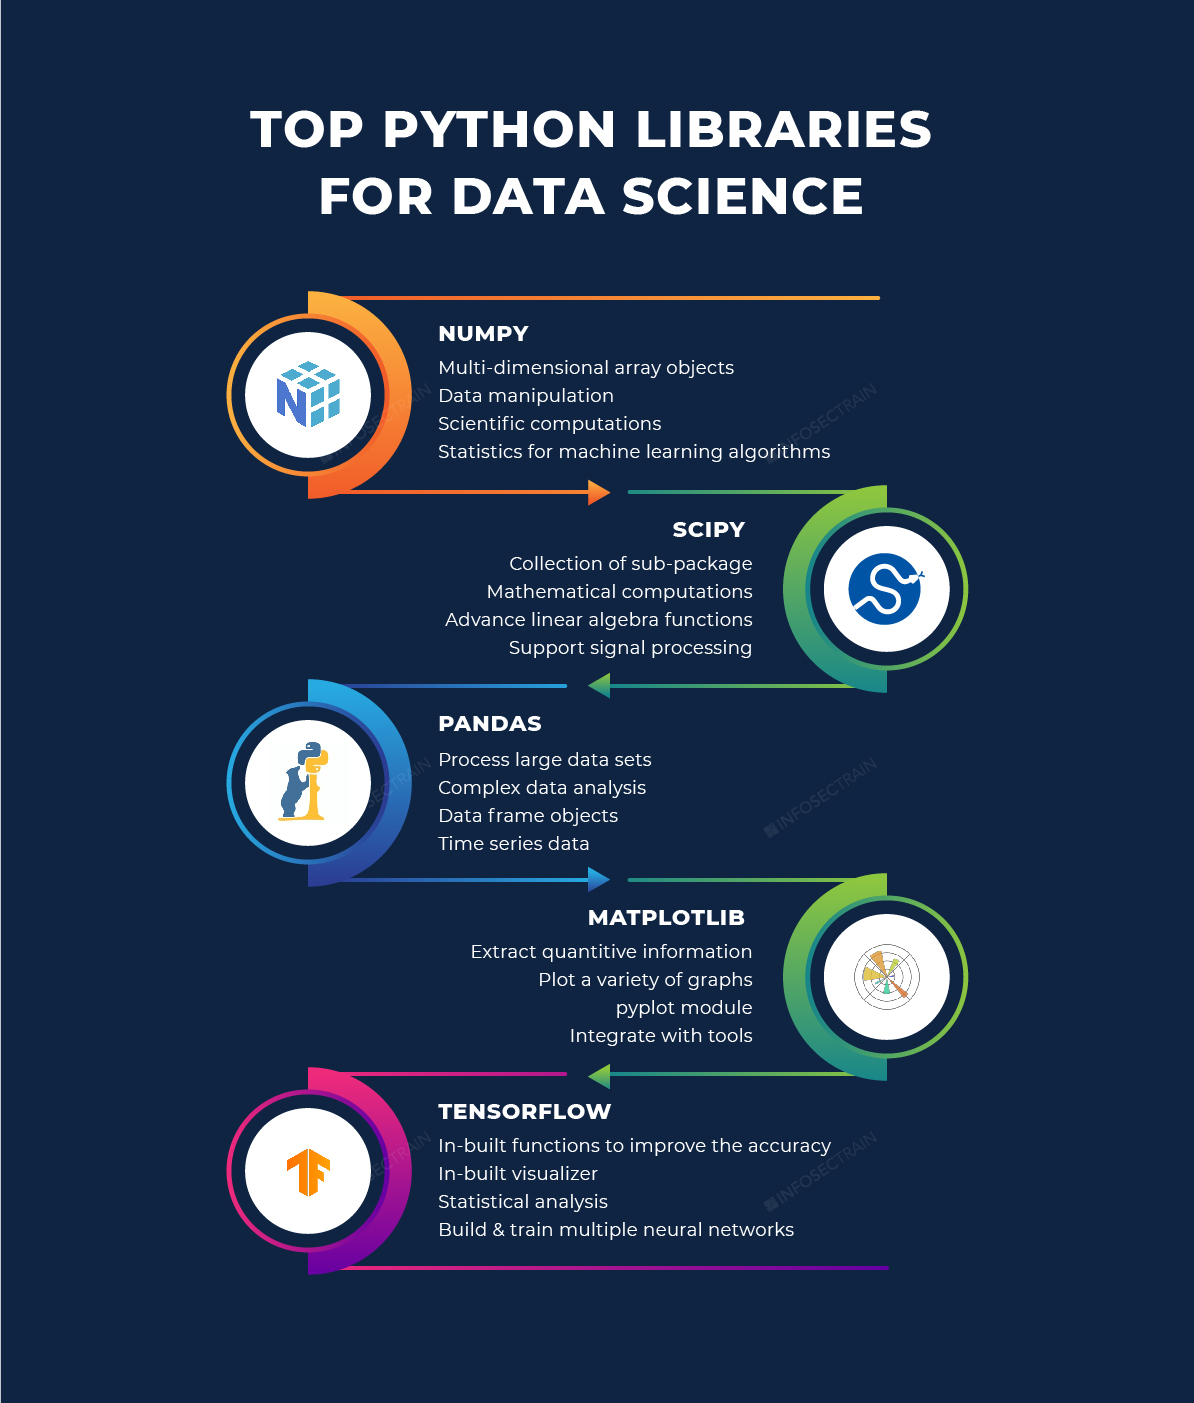
The single most significant reason for the popularity of Python in the field of Data Science, Machine Learning, and Artificial Intelligence is that Python provides thousands of inbuilt libraries that have inbuilt functions and methods to efficiently carry out data analysis, data processing, wrangling, modeling and so on. So here are the top Python libraries for Data Science.
- NumPy
- SciPy
- Pandas
- Matplotlib
- TensorFlow

1. NumPy
NumPy is also known as Numerical Python. It is one of the most basic Python libraries for statistics. Here are the features of NumPy:
- One of the main features of NumPy is multi-dimensional arrays for mathematical and any sort of logical operations that you want to perform.
- NumPy functions are used to index, sort, and pre-shape images and sound waves in a multi-dimensional array as an array of real numbers.
- It helps you to perform simple to complex mathematical and scientific computations.
- It supports multi-dimensional array objects and a collection of functions and methods to process these array elements.
2. SciPy
NumPy is the foundation for SciPy, and this library is a collection of sub-packages that help in solving the most basic problem related to statistical analysis. This library is used to process the array of elements defined using the NumPy, and it is often used to complete mathematical equations that NumPy can’t do.
- It works along with the NumPy arrays.
- It provides a platform that helps in numerous numerical integration and optimization methods.
- It includes sub-packages for Vector Quantization, Fourier Transformations, and Integration.
- It also provides a full-fledged stack of linear algebra functions used for the most advanced competition, such as clustering, Kimi algorithms, and so on.
3. Pandas
This is one of the most important statistical libraries used as the main library in various fields, including statistics, finance, economics, data analysis, etc. Like SciPy, Pandas also depends on the NumPy array for processing Pandas and data objects.
- Pandas is one of the most useful libraries for dealing with large amounts of data.
- It creates fast and effective data frame objects with pre-defined and customized syntaxes.
- It can be used to do sub-sitting, data slicing, indexing, and other operations on huge data sets.
- It also provides in-built features for creating excel charts and performing any sort of complex data analysis task such as statistical analysis, data wrangling, transformation, manipulation, visualization, and so on.
4. Matplotlib
One of the most common data visualization libraries is Matplotlib. It can help with a wide range of crafts like plots, histograms, bar charts, and power spectra. So it is a 2D graphics library that produces very concise graphs.
- It makes it easy to plot graphs by providing a variety of graph functions.
- It also contains a pipe plot module that provides a primary interface similar to the MATLAB interface.
- It also provides an object-oriented API module that will help you integrate your graphs into many applications or tools, including WX Python, QTN, etc.
5. TensorFlow
TensorFlow is one of the most common deep learning libraries, and it is a mathematical library used to build strong and precise neural networks.
- It enables you to create and train numerous neural networks, which aids in the handling of massive projects and data sets.
- It also provides functions and methods that perform fundamental statistical analysis.
R
R is a programming language focused on statistical computation, with interaction and design well-suited to statistical and scientific activities. R’s rising popularity is because it has a simple syntax and includes the excellent RStudio utility and a variety of R packages.
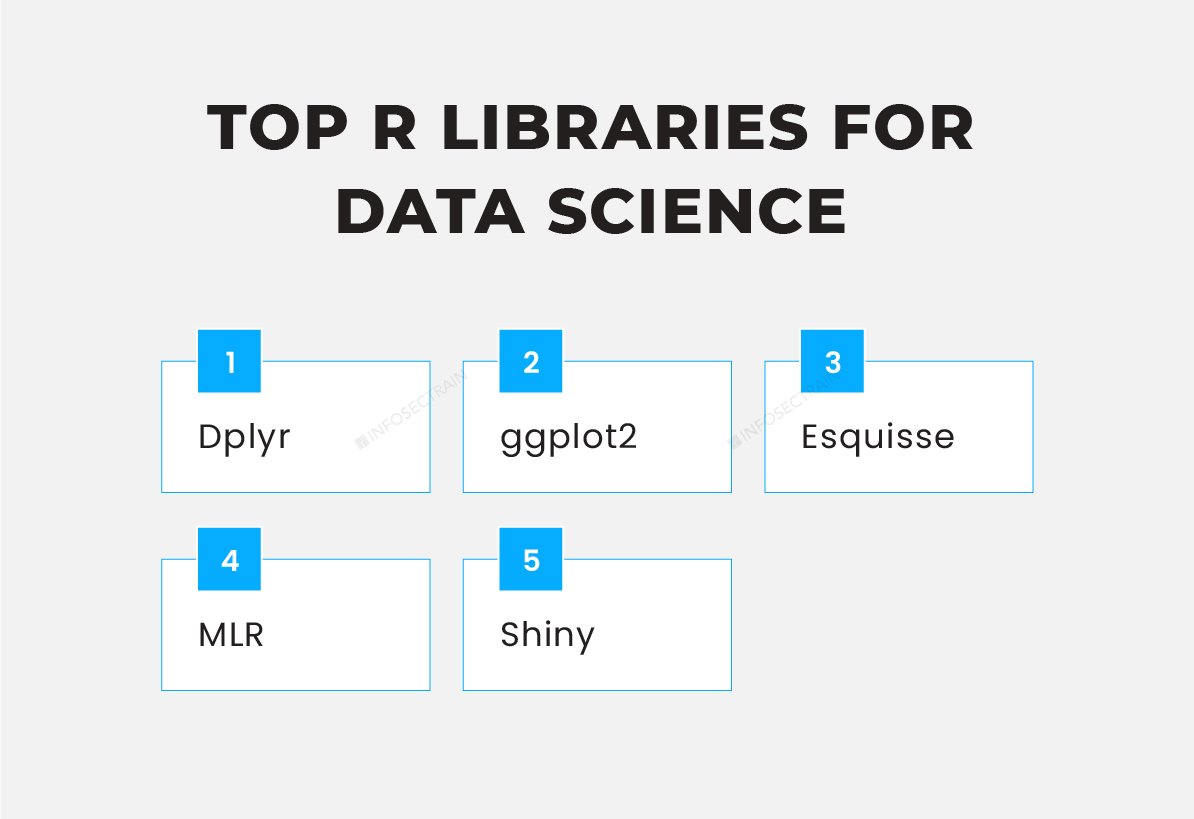
Top R Libraries for Data Science

1. Dplyr: It is a data manipulation library for R. It has five functions that help you to address the most common data manipulation problems.
- Mutate: It is used to create new values that are functions of the old ones
- Select: It chooses variables according to names.
- Filter: It filters and chooses the case according to the variable’s value.
- Summerize: It reduces the multiple data into a single summary.
- Arrange: It changes the sequence of rows and columns.
2. ggplot2: ggplot2 is an R package that implements the Syntax of Visualizations specifications to create graphics. By establishing links between data properties and their graphical representation, you can create high-quality graphical visualizations with ggplot2.
3. Esquisse: Esquisse is a data visualization package that is very easy and clear, bringing the most significant elements of Tableau to R using the well-known drag-and-drop method.
4. MLR: The MLR is the most widely used machine learning tool, and it includes supervised methods such as classification, regression, survival analysis, and methods for assessment and optimization.
5. Shiny: Shiny is the computational power of R and the interactivity of the modern hub that is easy to write and develops special web development skills. It is the ideal tool for creating interactive web apps directly from R.
Python and R with InfosecTrain
Besides these top Python and R libraries for Data Science, Machine Learning, and Artificial Intelligence, there are a plethora of other helpful Python and R libraries that should be explored. If you want to become an expert in these libraries and are interested in learning and mastering Data Science with Python and R, head into InfosecTrain’s Data Science with Python and R certification training course.


 1800-843-7890 (IN)
 sales@infosectrain.com
 1800-843-7890 (India)
